Monitored Hours
Work at the jail site is permitted in set hours, after-hours permits authorize more, and noise and vibration are monitored in hours of their own.
After-hours work variances
634 days, authorized in permits of fourteen days or less.
The Department of Buildings issued seventy-nine after-hours permits for site preparation on the jail site between 7 September 2022 and 20 September 2024. Seventy-one of them form a chain from 27 December 2022: each starts no later than the day after the last one ended, so the authorization never lapses.1
Together the seventy-nine permits authorize 2,156 hours: six to seven on weekday mornings, and at weekends from six or seven in the morning to half past three in the afternoon. On 450 of the chain’s 454 weekdays, the hour before the permitted working day was authorized.
From 22 July to 17 November 2023 the permits were issued a week at a time: seventeen consecutive seven-day permits, 119 days of continuous authorization.
Work permitted
7am–6pm
After-hours authorized450 of 454 weekdays, 27 Dec 2022 – 20 Sep 2024
6–7am
Noise monitored
7am–3:30pm
Vibration monitored
all day
Noise
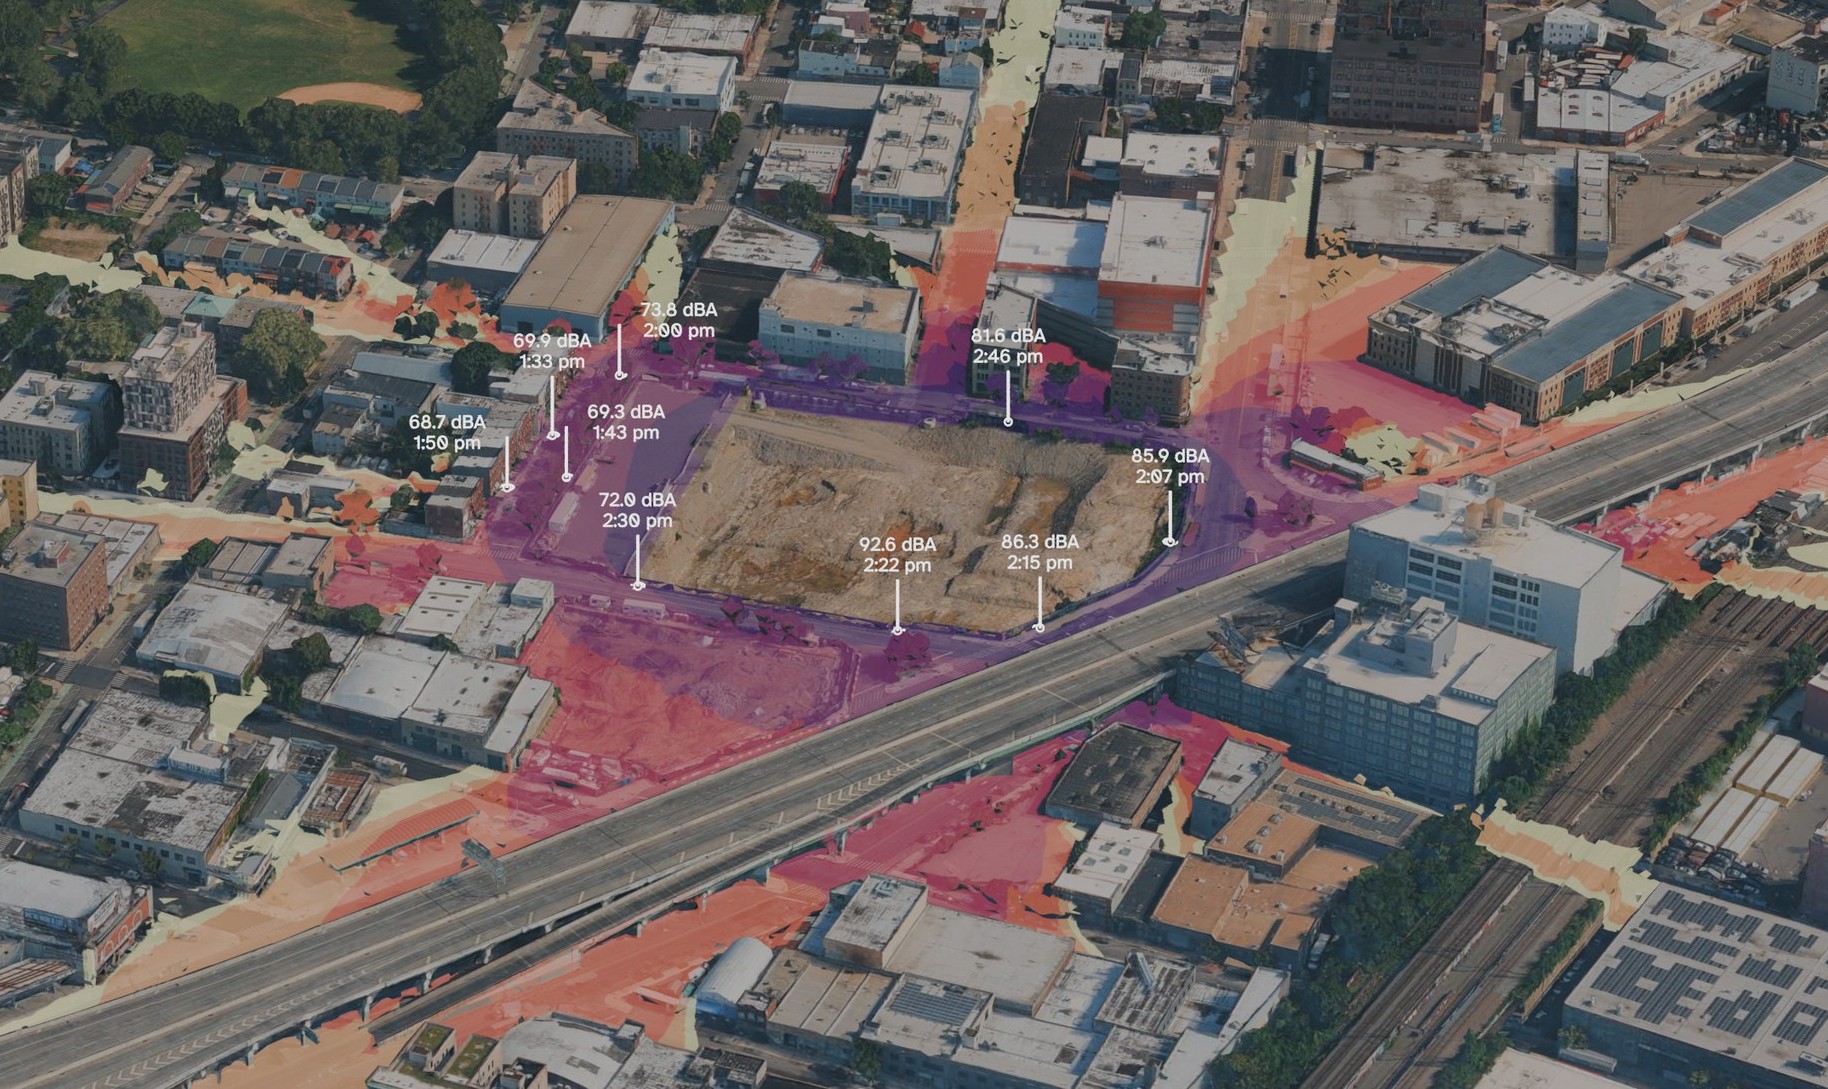
Modeled noise around the jail site, matched to the site’s meters
1-hour average (Leq), dBA. Projection, not measurement.
My readings, 27 July 2026 (1-minute Leq)
A minute’s reading is not an hour’s average. The difference is what an average leaves out.
45505560657075+dBA
Modeled noise around the Bronx jail site, matched to the site’s meters, as a 1-hour average at street level. dBA is decibels weighted to how the human ear hears. The model is matched to the site’s five fixed noise meters (hourly records, January to July 2026). Meters record all sound at the fence.
The white markers are nine readings I took on 27 July 2026 between 1:33 and 2:46 pm, with a Gain Express SLM-24 sound level meter: A-weighted, fast response, each a 1-minute average (Leq). Across Concord Avenue my meter read 68.7 to 73.8 dBA, close to the model. At the site fence it read 81.6 to 92.6 dBA.2
Each monthly environmental monitoring report counts the days its monitors recorded noise above a stop-work level. The seven reports from January to July 2026 count fifty-two: one in January, six in February, seven in March, four in April, eight in May, eleven in June and fifteen in July.
Vibration
The environmental review modeled three houses on the row by address: 325, 337 and 349 Concord Avenue. 327 was not one of them.
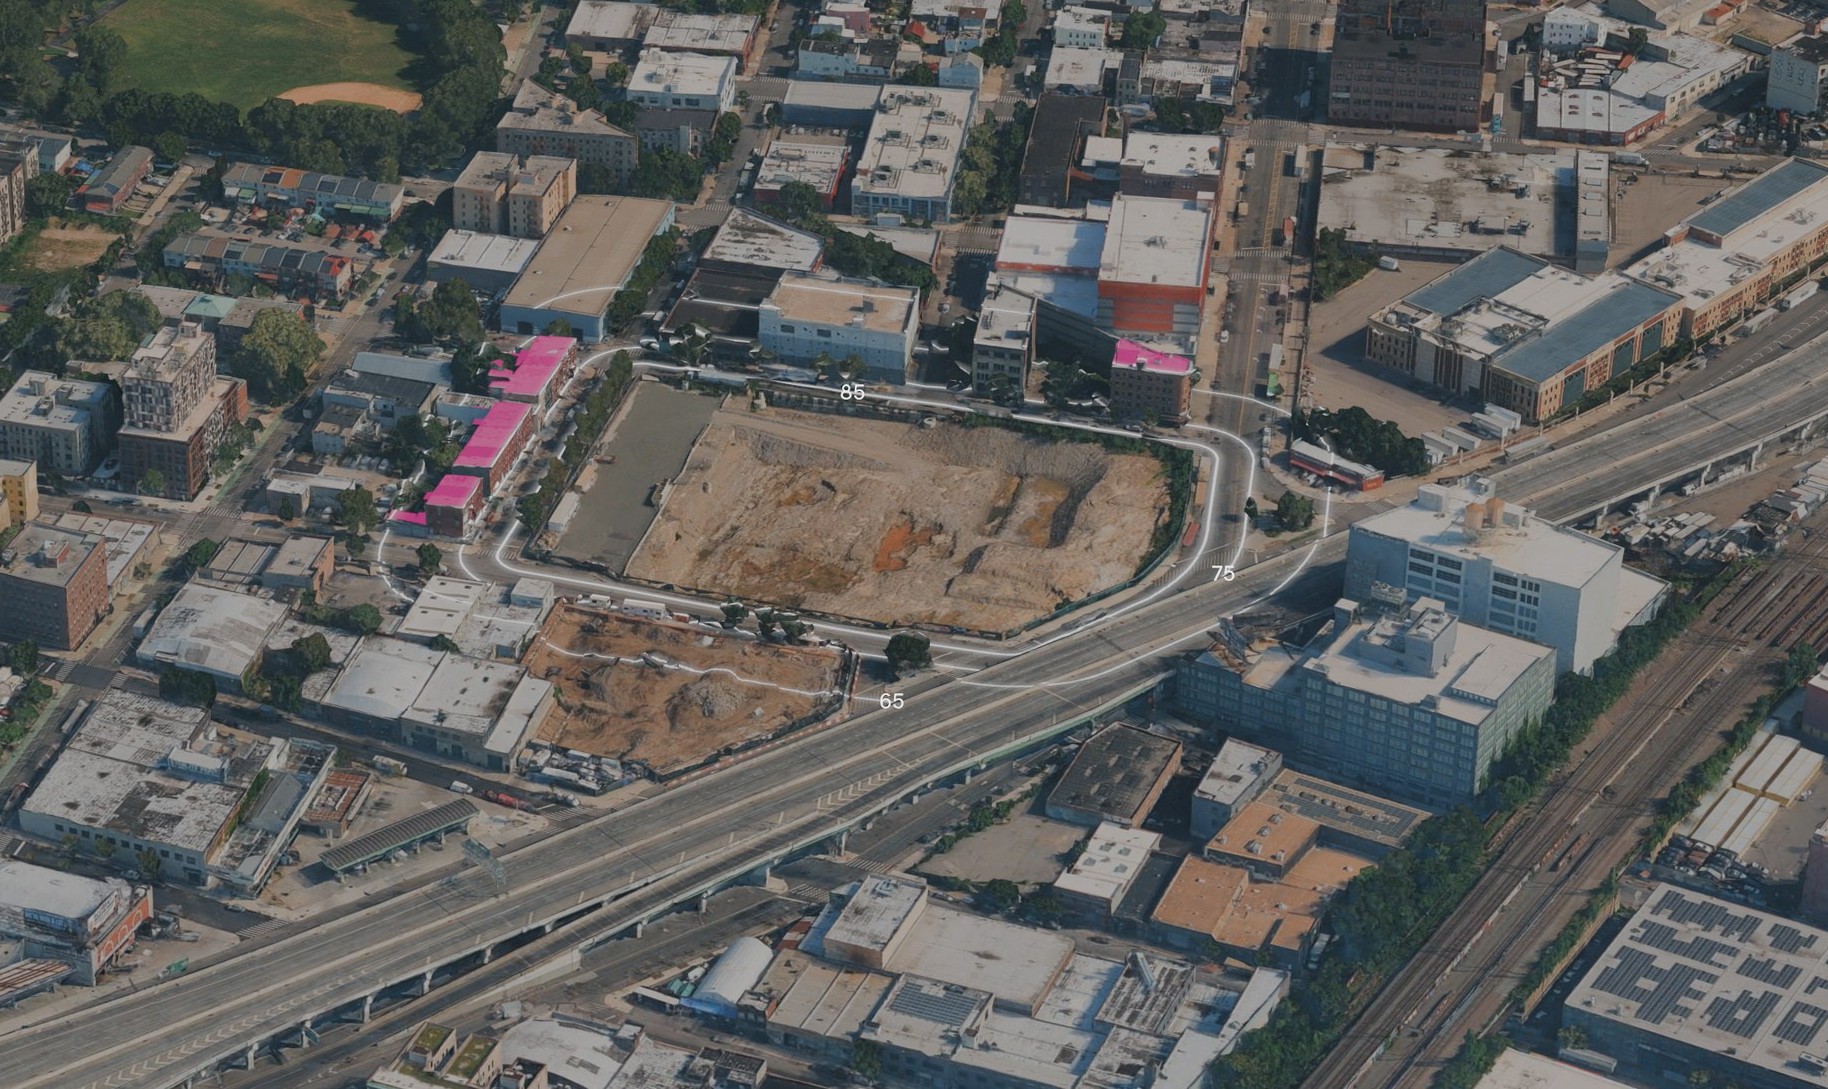
Modeled vibration around the jail site
Projection, not measurement. One machine at the edge of lots 1 and 2.
85 VdB · 8.9 m
75 VdB · 19.1 m
65 VdB · 41.2 m
Residential units inside the 65 VdB line
Modeled reach of construction vibration from the Bronx jail site during site preparation, with the residential units inside it. VdB (vibration decibels) is the Federal Transit Administration’s scale for ground vibration as people feel it; 65 VdB is about where many people begin to feel it. Distances are from the lot edge; each ring carries its level (85, 75, 65). South of East 141st Street the 65 VdB ring crosses a vacant lot, where it follows the ground’s mounds.
The highlighted roofs are the 67 residential units on 17 lots inside the 65 VdB line, 41.2 m from the lot edge, including the whole Concord Avenue row about 20 m from the site.3
Dust
Dust above the stop-work level at the Bronx jail site, January–August 2026.
Each particle is one dust reading the builder’s monthly reports list above 150 μg/m³, the level at which the reports say work must stop, measured as PM-10 over fifteen minutes. The level is the same in every month of the eight; what changes is the number of days that reach it, from none in January to eleven in July.
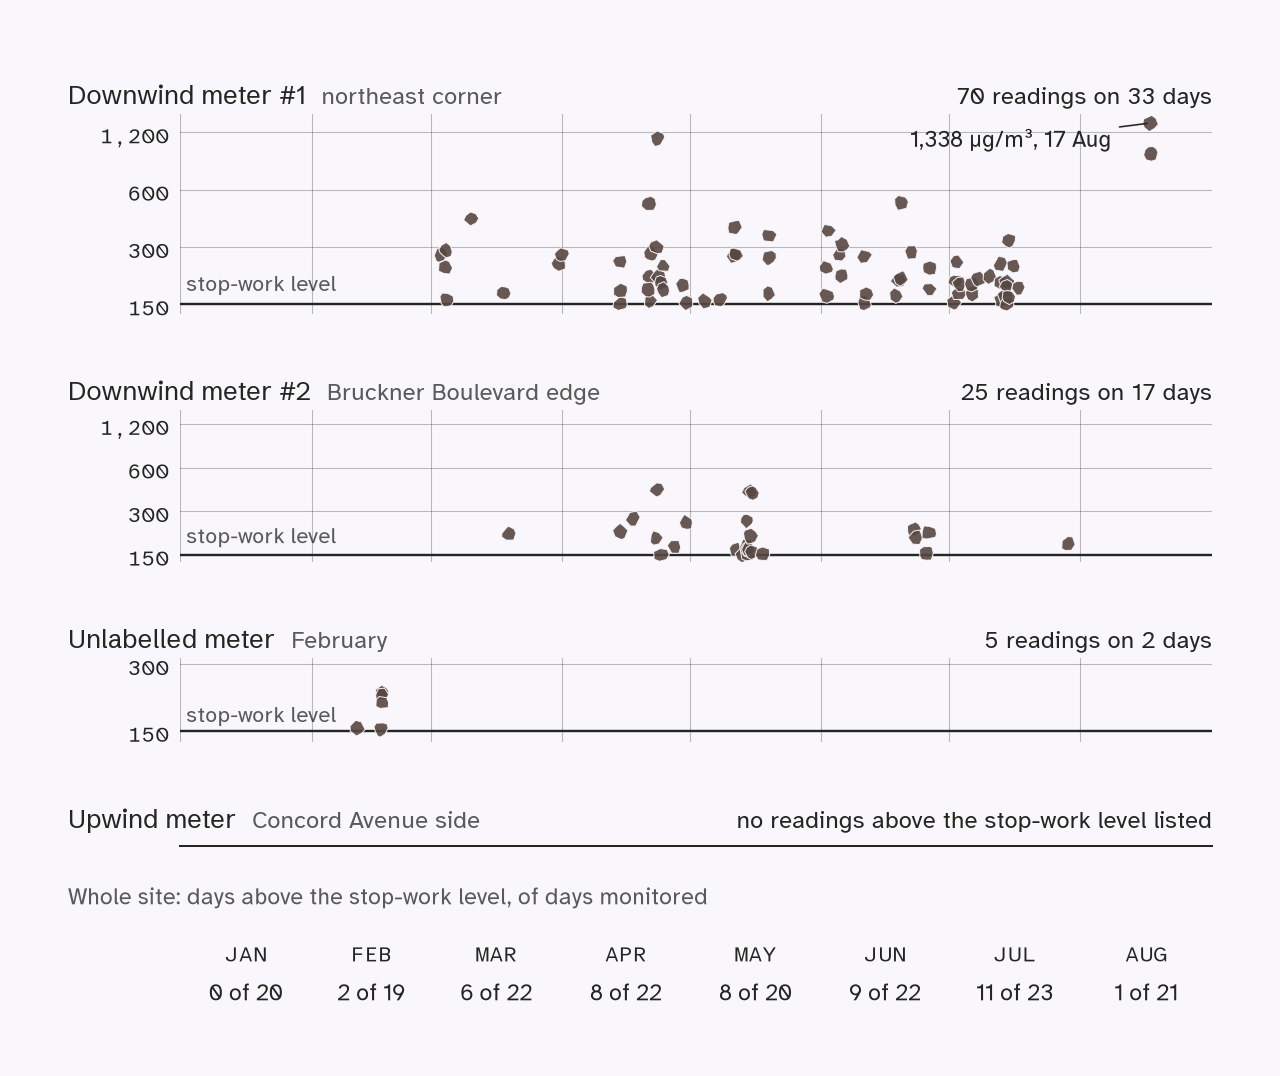
The two downwind meters stand on the site fence; the upwind meter, on the Concord Avenue side, is the reference they are compared against, and it shows no readings above the stop-work level. The meter at the north-east corner listed 70 readings on 33 days; the one on the Bruckner Boulevard edge, 25 readings on 17 days. Across the whole site, the reports count 45 days above the stop-work level from January to August, following the rise set out above. The highest reading was 1,338 μg/m³, on 17 August, on a day that was the only one above the level that month.4
These meters measure PM-10, particles ten micrometers across and smaller. The US Environmental Protection Agency lists construction sites among the direct sources of such particles, and aggravated asthma among the health problems linked to them. A national study of nearly eight million children enrolled in Medicaid found that higher long-term exposure to coarse particles, between 2.5 and 10 micrometers, was associated with more asthma, more asthma emergency department visits and more hospitalizations, with younger children the most affected. In Community District 1, the district this study area sits in, child asthma emergency department visits ran at 326.9 per 10,000 children aged 5 to 17 in 2023, against 143.7 citywide. That district is 3,975 tax lots and the corridor this project follows is thirty-five of them, and the year is before these readings begin. These are neighborhood and national figures: they do not measure what this site’s dust has done, or the health of the people who live nearest it.5
Air
Black carbon around the Bronx jail site, and who is near it.
A modeled yearly average, December 2023 to December 2024. The city’s air survey splits New York into 9,656 squares about 300 meters across; the shading shows how each square here ranks among them.

Schools within 800 meters. Numbers match the map.
- 411 Wales Avenue: Neighborhood Charter School: Bronx (charter, opened 2019)
- 677 East 141 Street: P.S. 065 Mother Hale Academy (DOE, 1924); Academic Leadership Charter School (charter, 2009)
- 447 Wales Avenue: Urban Assembly Charter School for Computer Science (charter, 2018)
- 455 Southern Boulevard: H.E.R.O. High (DOE, 2013); Mott Haven Community High School (DOE, 2012)
- 470 Jackson Avenue: J. M. Rapport School Career Development (DOE, 1999); University Prep Charter Middle School (charter, 2019)
- 604 East 139 Street: Strive Charter School (charter, 2022)
- 510 East 141 Street: P.S. 030 Wilton (DOE, 1924); American Dream Charter School (charter, 2014)
- 811 East 149 Street: P.S. 025 Bilingual School (DOE, 1897)
- 564 Jackson Avenue: P.S. 5 Port Morris (DOE, 1961)
Detention and shelters. Letters match the map.
- A. Horizon Juvenile Center, 560 Brook Avenue
- B. Bruckner emergency shelter (HERRC), 825 East 141 Street: opened February 2025, about 2,200 adults
- C. DHS family shelter, 323 Jackson Avenue
- D. Powers Family Residence, 346 Powers Avenue
- E. Jackson Family Residence, 691 East 138 Street
- F. Willow Avenue Shelter, 781 East 135 Street
The city’s air survey models black carbon for every square of the city, about 300 meters across; the health department describes it as “a major component of fine particles, which contribute to both short-term health effects and chronic illness”. Every square on this map is among the most polluted quarter of the city. The square that holds the jail lot is more polluted than 97.5 per cent of the city’s squares: 0.85 µg/m³, against a city median of 0.49.6
Thirteen schools stand within 800 meters of the center of the jail lot. Six are charter schools, and four of those opened between 2018 and 2022. Every one of the thirteen sits in a square more polluted than 92 per cent of the city’s. Horizon Juvenile Center and five shelters are outlined, among them the Bruckner emergency shelter at 825 East 141 Street, which opened in February 2025 with a stated capacity of roughly 2,200 adults. The circles mark lots recording 50 or more homes.
Measured by district, the picture is milder. Community District 1 ranks 10th of 59 districts for black carbon and 19th for fine particles in 2025, and 12th for truck traffic in 2019. A district average spreads the corridor’s cells across the whole district, so the two measures answer different questions.
These are modeled yearly averages for areas, not measurements at any school, shelter or home, or at the fence. They do not show where the pollution comes from, and they do not measure what this site’s dust or works have done to anyone.
The hours no instrument records are set out in THE GAP.